
13
Jan
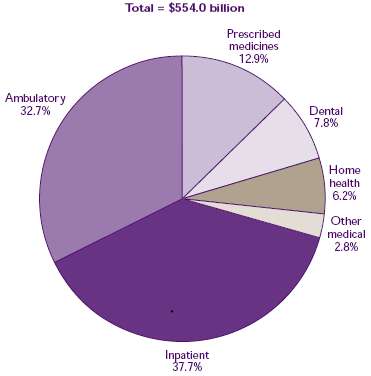
What Does Your Medical and Dental Expense Pie Chart Look Like?
We found this image online and were immediately intrigued! This chart breaks down spending on health for Americans way back in 1997. What do you think about the numbers? Do you think the percentages have shifted today?
Dental Care at 7 Percent of Total Medical Expenses
Back in the 1990s, it looks like dental care came in at just under ten percent of national health expenses. The highest percentages—37 percent and 32 percent respectively—were held by inpatient care and ambulatory care. Of course, another study taken by the U.S. Department of Health in 2004 estimated that only 43 percent of Americans went to the dentist at all, so that may be affecting the numbers.
Are Your Dental Visits Preventative or Diagnostic?
This same 2004 study by the Department of Health also found that more people (89 percent of people, in fact!) made a diagnostic appointment (that is, to solve a problem or pain) than a preventative appointment (where a dentist checks to see that teeth are healthy and cleans them to keep them healthy longer). Hopefully in the last ten years patients have come to recognize more and more the importance of preventative care—then you never get to the diagnostic point!
What Do You Pay Out of Pocket?
While the biggest national medical expense was for inpatient care, most people paid less than two percent out of pocket, which gives inpatient care a fairly expensive price tag. Dental care however, was paid out of pocket about half the time (51 percent). And that was back in the 1990’s. With new health care laws requiring that children’s preventative dental care be included in coverage, Americans are looking at even more coverage for dental care in the coming years. That preventative care includes “teeth cleaning, X-rays and fillings, and medically necessary orthodontics,” according to the Washington Post.
How do you think your medical expenses pile up in a pie chart? Is your biggest expense inpatient care? Medication? Supplies? Let us know at your next preventative appointment!
